Monitoring
Kapstan's out of the box monitoring provides a comprehensive overview of the deployed applications' health and resource utilization.
To access this page, navigate to the Services page and then click on the "Monitor" tab.
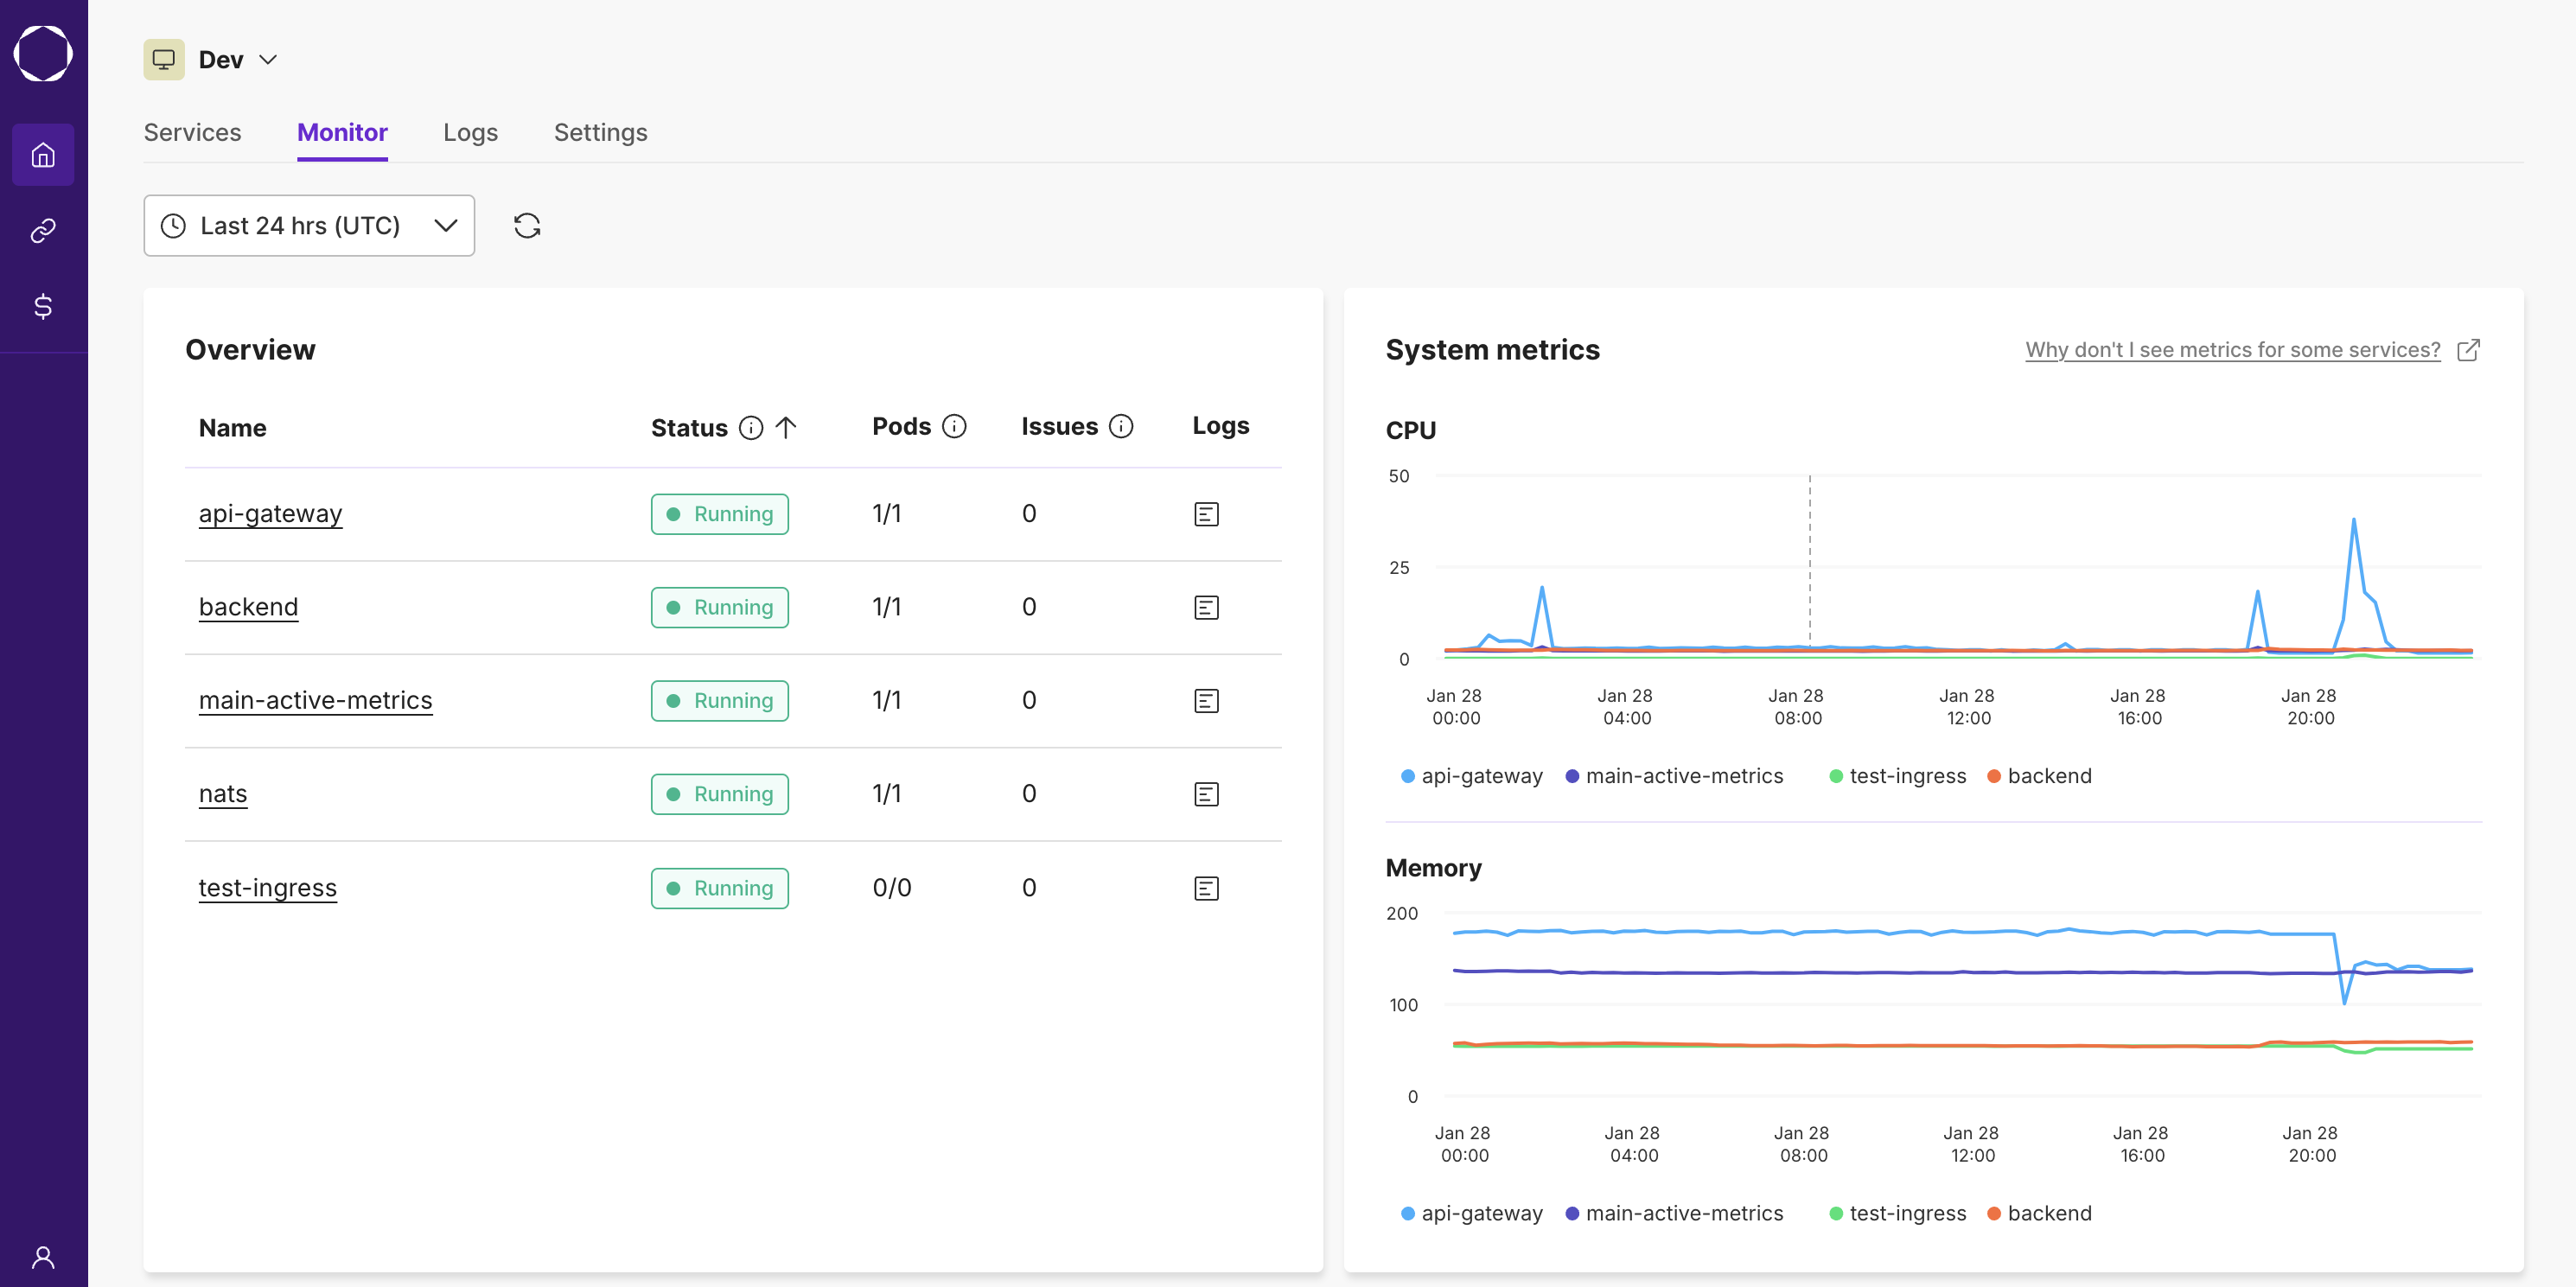
Get a health overview for all applications deployed in your environment.
View status, number of running pods and open issues for all applications at a glance.
View current CPU and memory utilizations or analyze the trend over a period of time.

You can deep dive into the health of a particular application by visiting the monitoring page for that application.
Here you can get detailed information about all the running pods for this application, including container information like status, restart count and related issues.

The Containers column shows the status of each container within the pod. Hover over the colored dots to get further information about the image running in that container and its current status.
The Restarts column shows the sum of restarts for every container in the pod. Hover over the count to see the breakdown per container.
System Metrics
You can view the CPU and memory utilization at an application and pod level in respective monitoring views.
Utilization is computed using the formula:
resource utilization = (amount of resource used by the application) * 100 / (amount of resource configured for the application)
Values in the charts can be greater than 100% if resource consumption is greater than the configured resource limit. Learn more about how to set allocate resources here. For more details, check out the Kubernetes resource usage documentation.
Out of the box monitoring does not work for public helm charts as of now.
Time trend
Only metrics up to the last 7 days are available for search.
You can hover over each line to view more details.
Hovering over a single line on the chart or a legend item would also dim the other lines for better visualization.
If you want to monitor a particular application/pod, you can select it by clicking on the corresponding legend item. This would hide the other lines on the chart. Clicking on the selected legend again would de-select it.
You can even select multiple lines by holding shift on your keyboard while clicking on the legend items.
Application Performance Monitoring (APM)
Kapstan offers out-of-the-box application performance monitoring (APM).
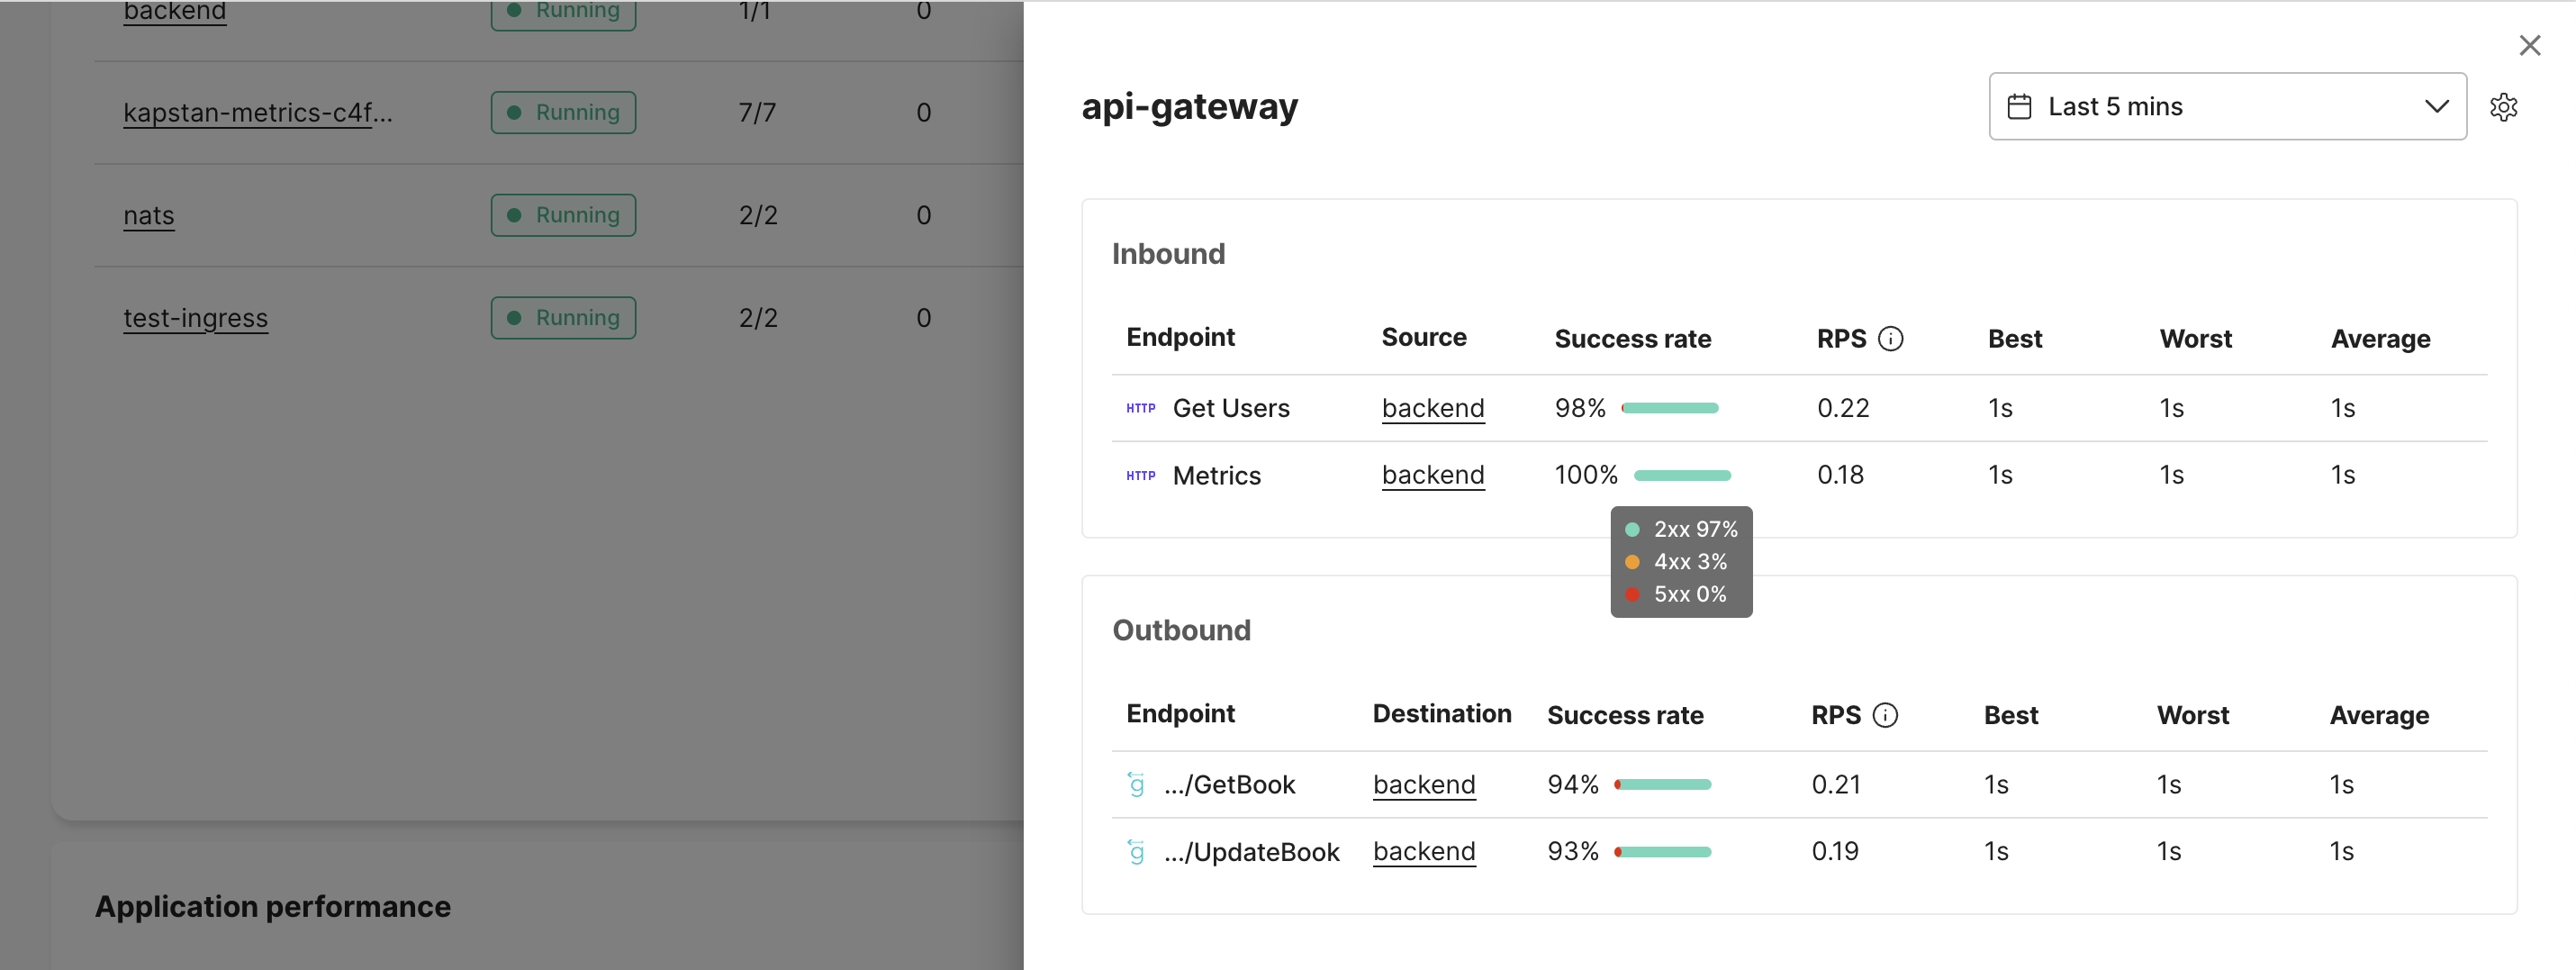
Get key performance metrics in the "Application performance" section, such as success rate, requests per second (RPS), and latency percentiles (P50, P95, P99) for each service. The number in each column shows the current value, along with a time trend to review past data.

Click on any application to get more details on the HTTP or gRPC calls for that application. gRPC endpoints are automatically classified into meaningful groups, while all HTTP metrics appear in a single row.

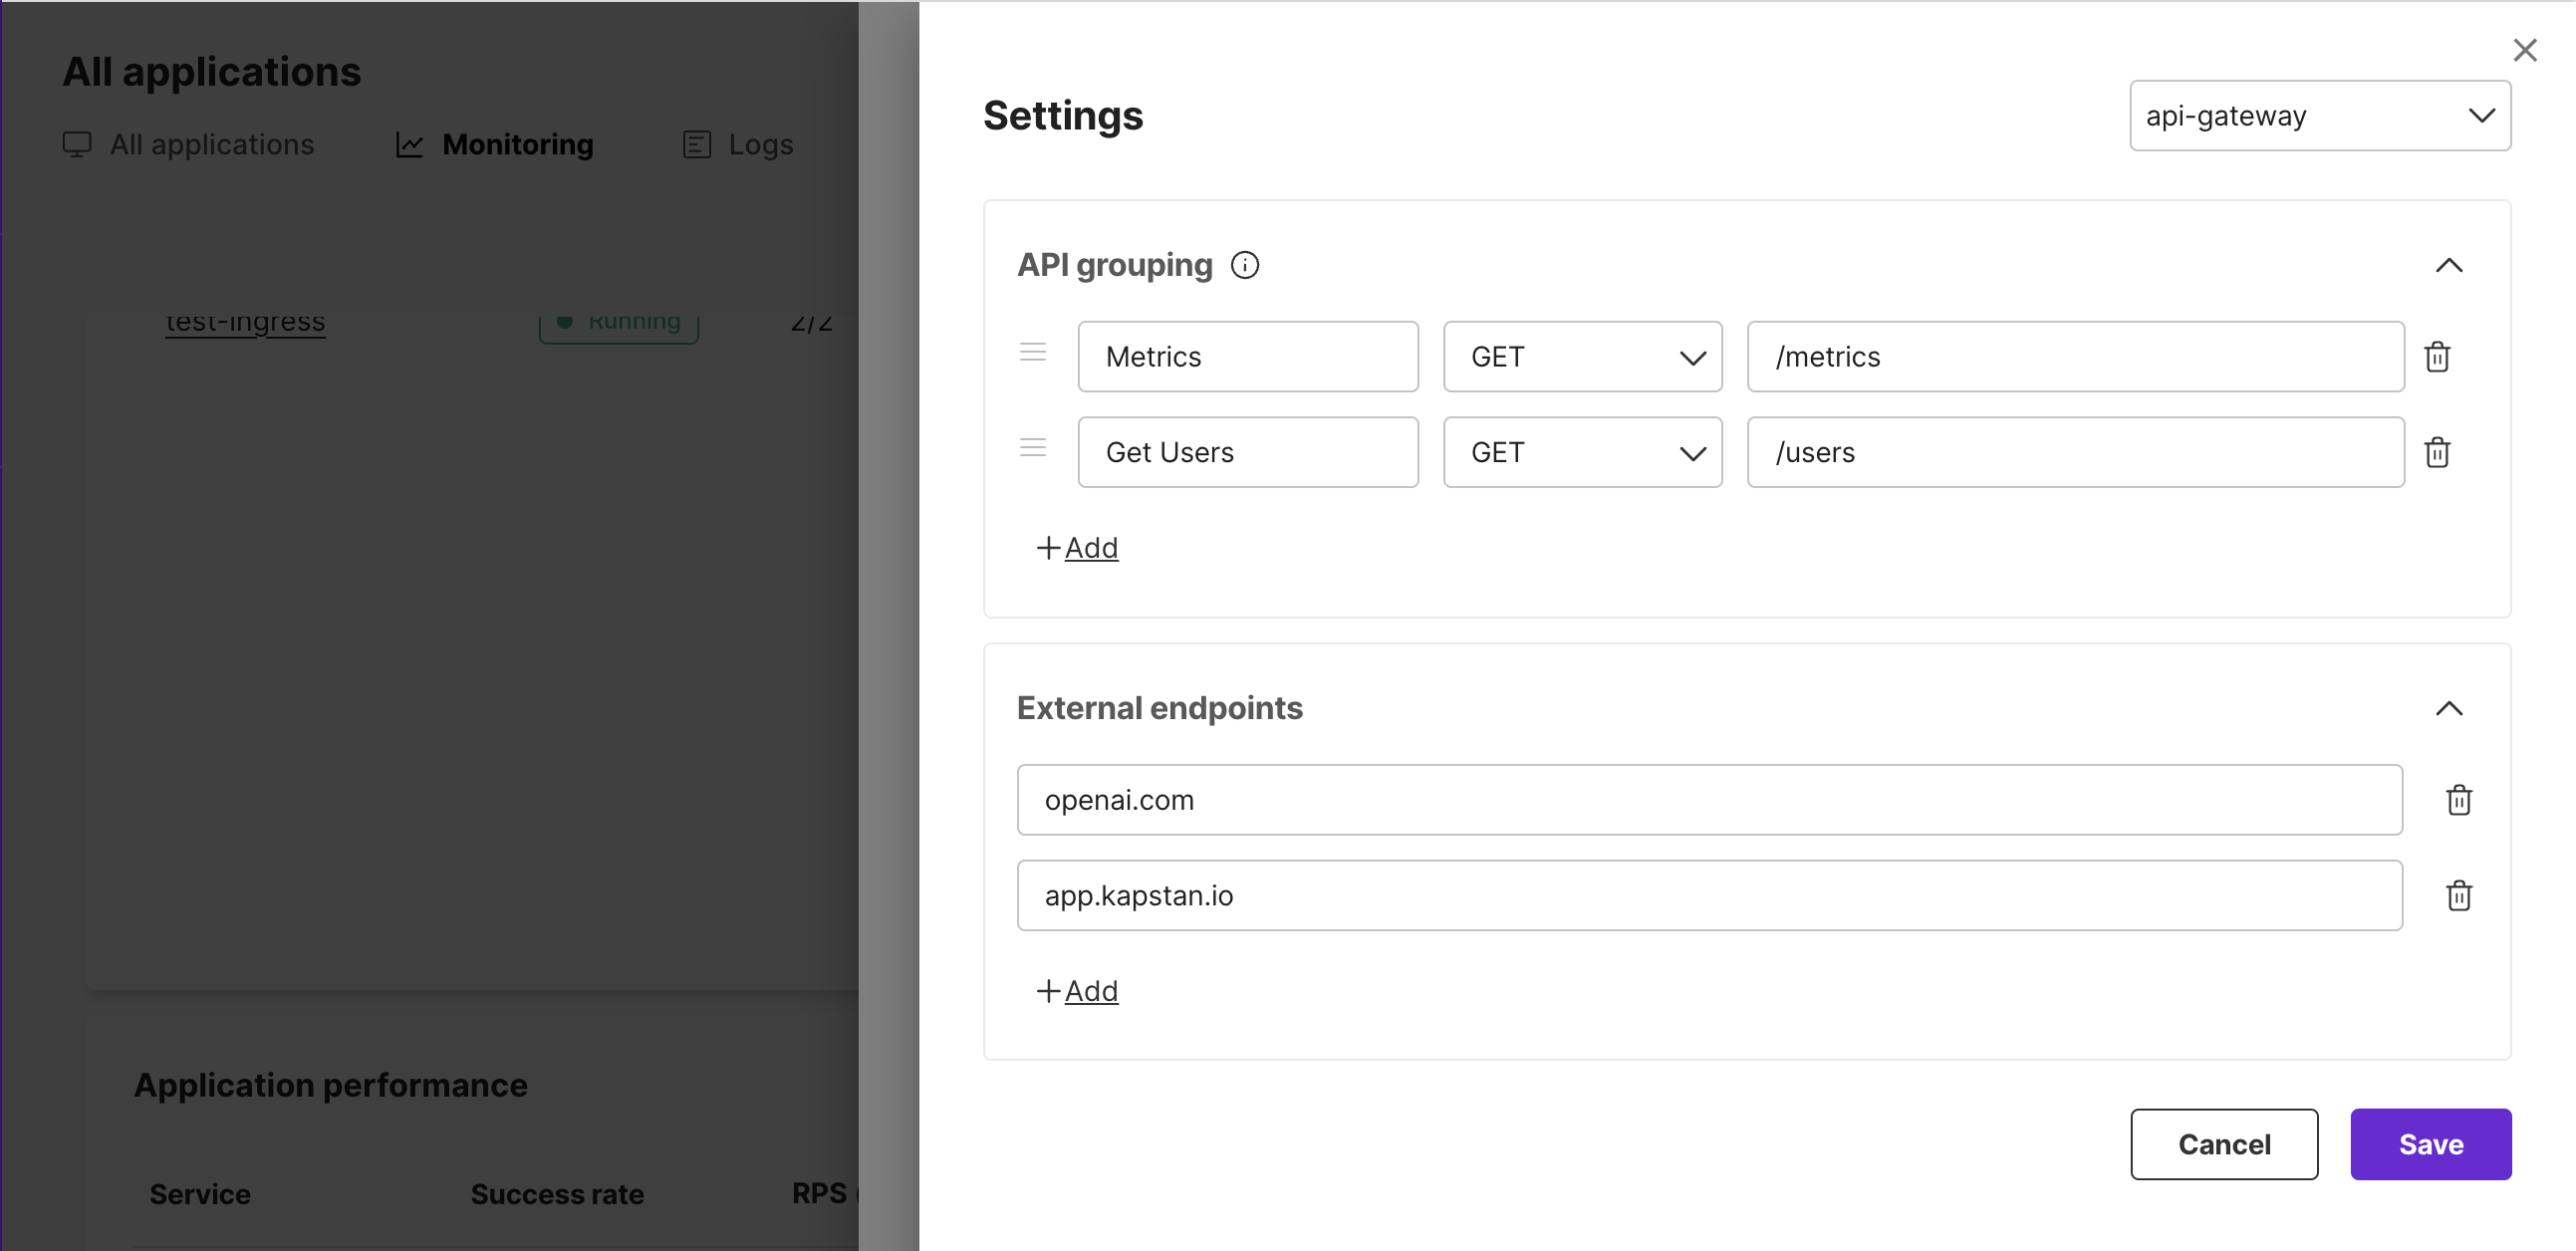
For granular observability, you can classify HTTP endpoints using regular expressions. Configure HTTP API paths with regex expressions, such as "/users/[[:alpha:]]", to better organize and monitor your endpoints. You must redeploy your application in order for these configurations to take effect. Learn more about regex syntax.

To receive metrics for these endpoints, ensure that your application sends unencrypted traffic. The traffic will be automatically encrypted before it exits your cluster.
By leveraging APM, you can monitor dependencies and maintain optimal application performance.
Viewing data in Monitoring
Latest data is continuously fetched at an interval of 1 minute. There is a "reload" button for you to manually refetch fresh data.
The following behavior is only present on the "Monitoring" page for all applications.
There is a pods dropdown to filter a specific pod. You can also select multiple pods from the dropdown.
Conclusion
The "Monitoring" feature empowers you to proactively manage and monitor the health of your deployed applications. Whether assessing real-time utilization or analyzing historical trends, this feature provides a comprehensive toolkit for ensuring optimal performance and resource allocation.

