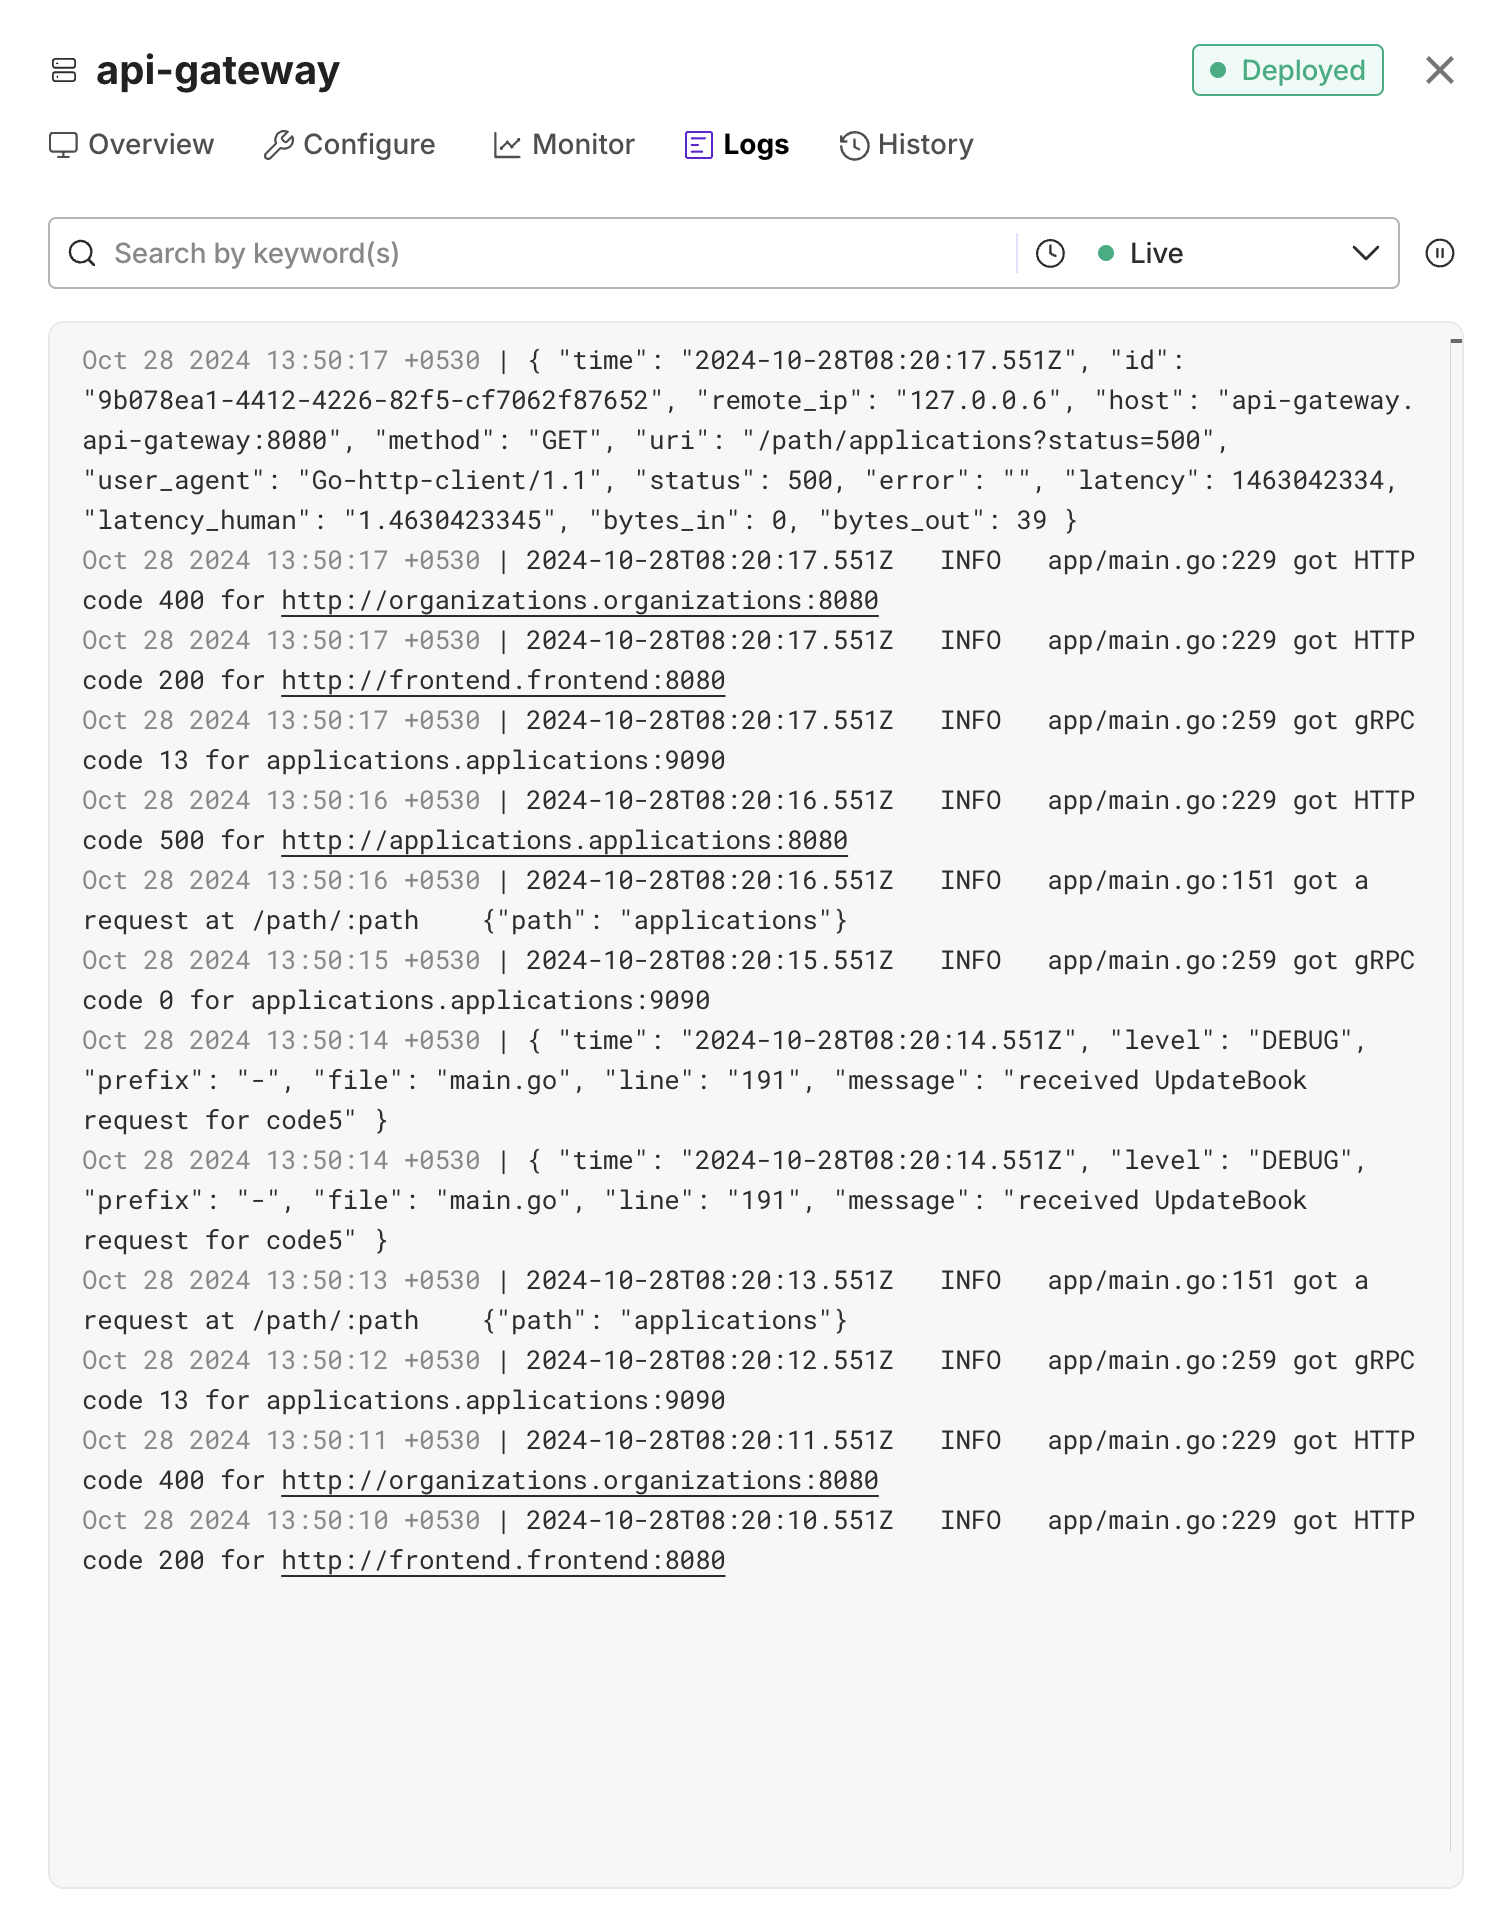
Live Logs
"Live Logs" feature allows you to monitor latest log entries in real-time. This is particularly useful for troubleshooting, debugging, and monitoring the activity of your service.

To access "Live Logs"
- While on the Services page, select the service you want to check the logs for.
- Click on "Logs" tab in the top navigation.
Navigating Live Logs
By default, the page keeps refreshing with the latest logs and the old logs are removed from the page. There are some controls that you can use to filter the logs or to switch view to help you with your debugging.
Keywords search
If you want to debug log lines with certain keywords, you can find them using the "Search" box. Type the keyword you want to search and press enter. All the logs where these keywords are present will be shown. The searched keywords would also be highlighted separately.

If multiple keywords are specified, then only those logs will be displayed that have all specified keywords present in them.
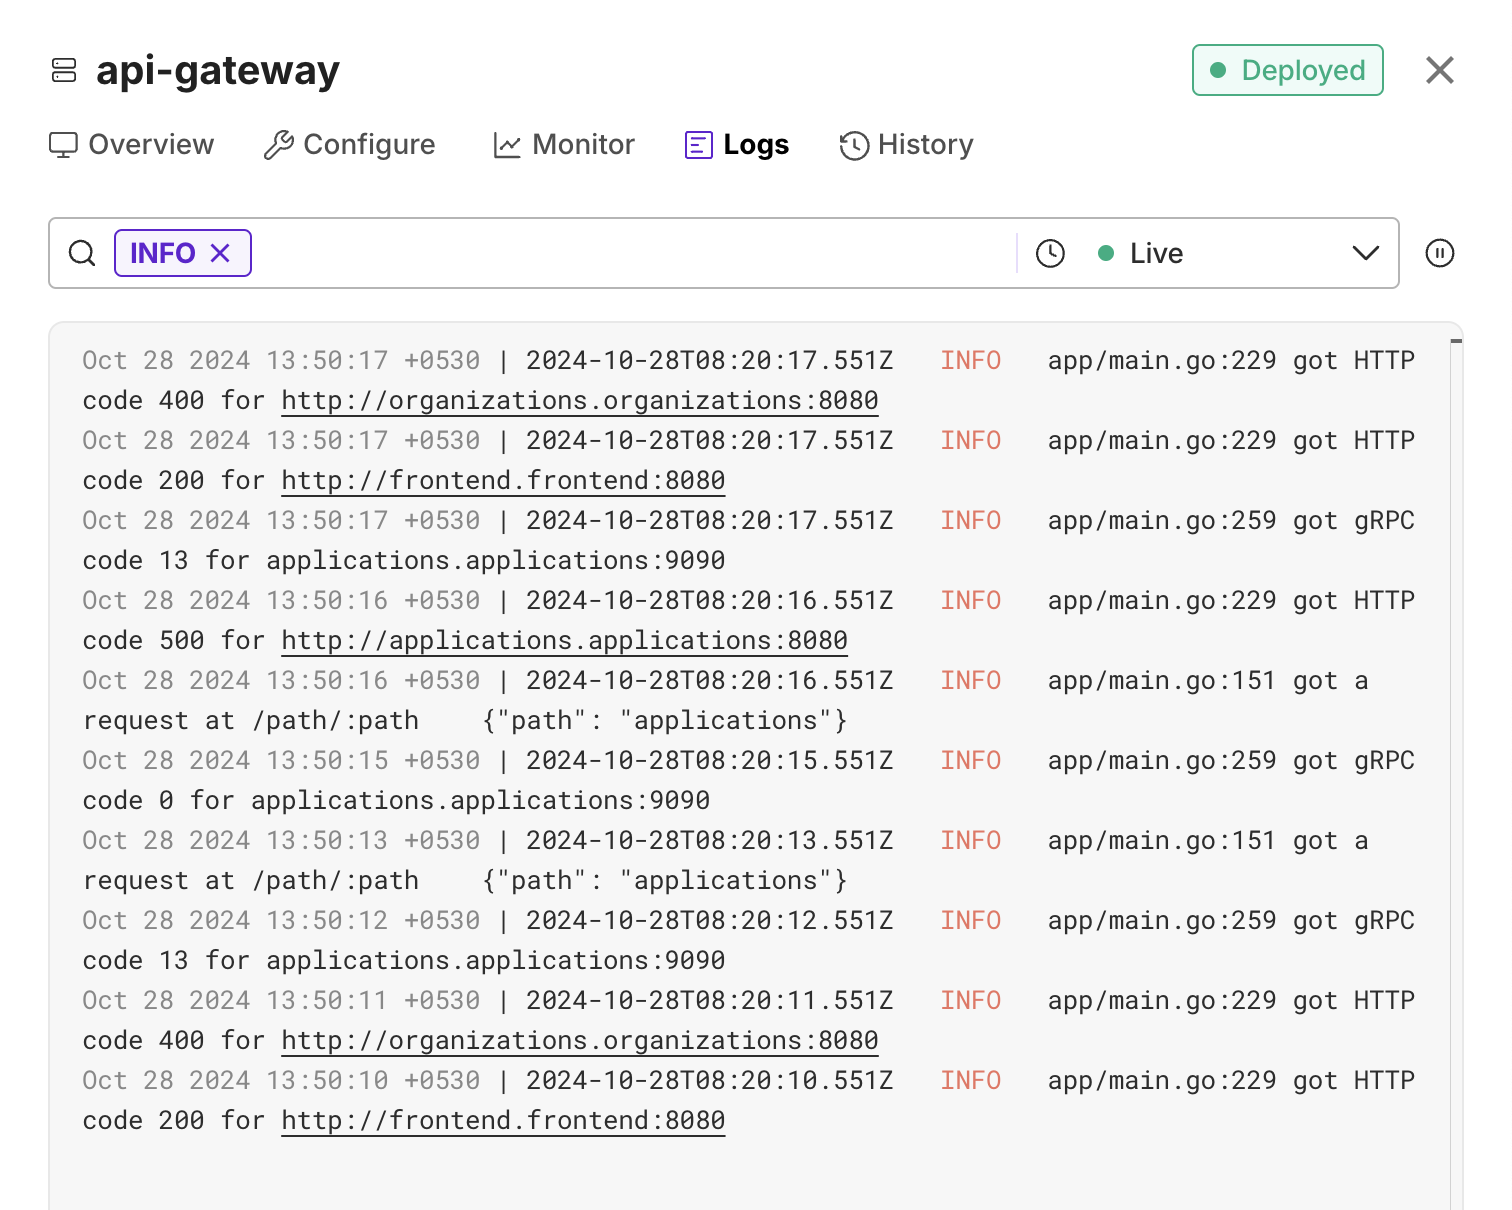
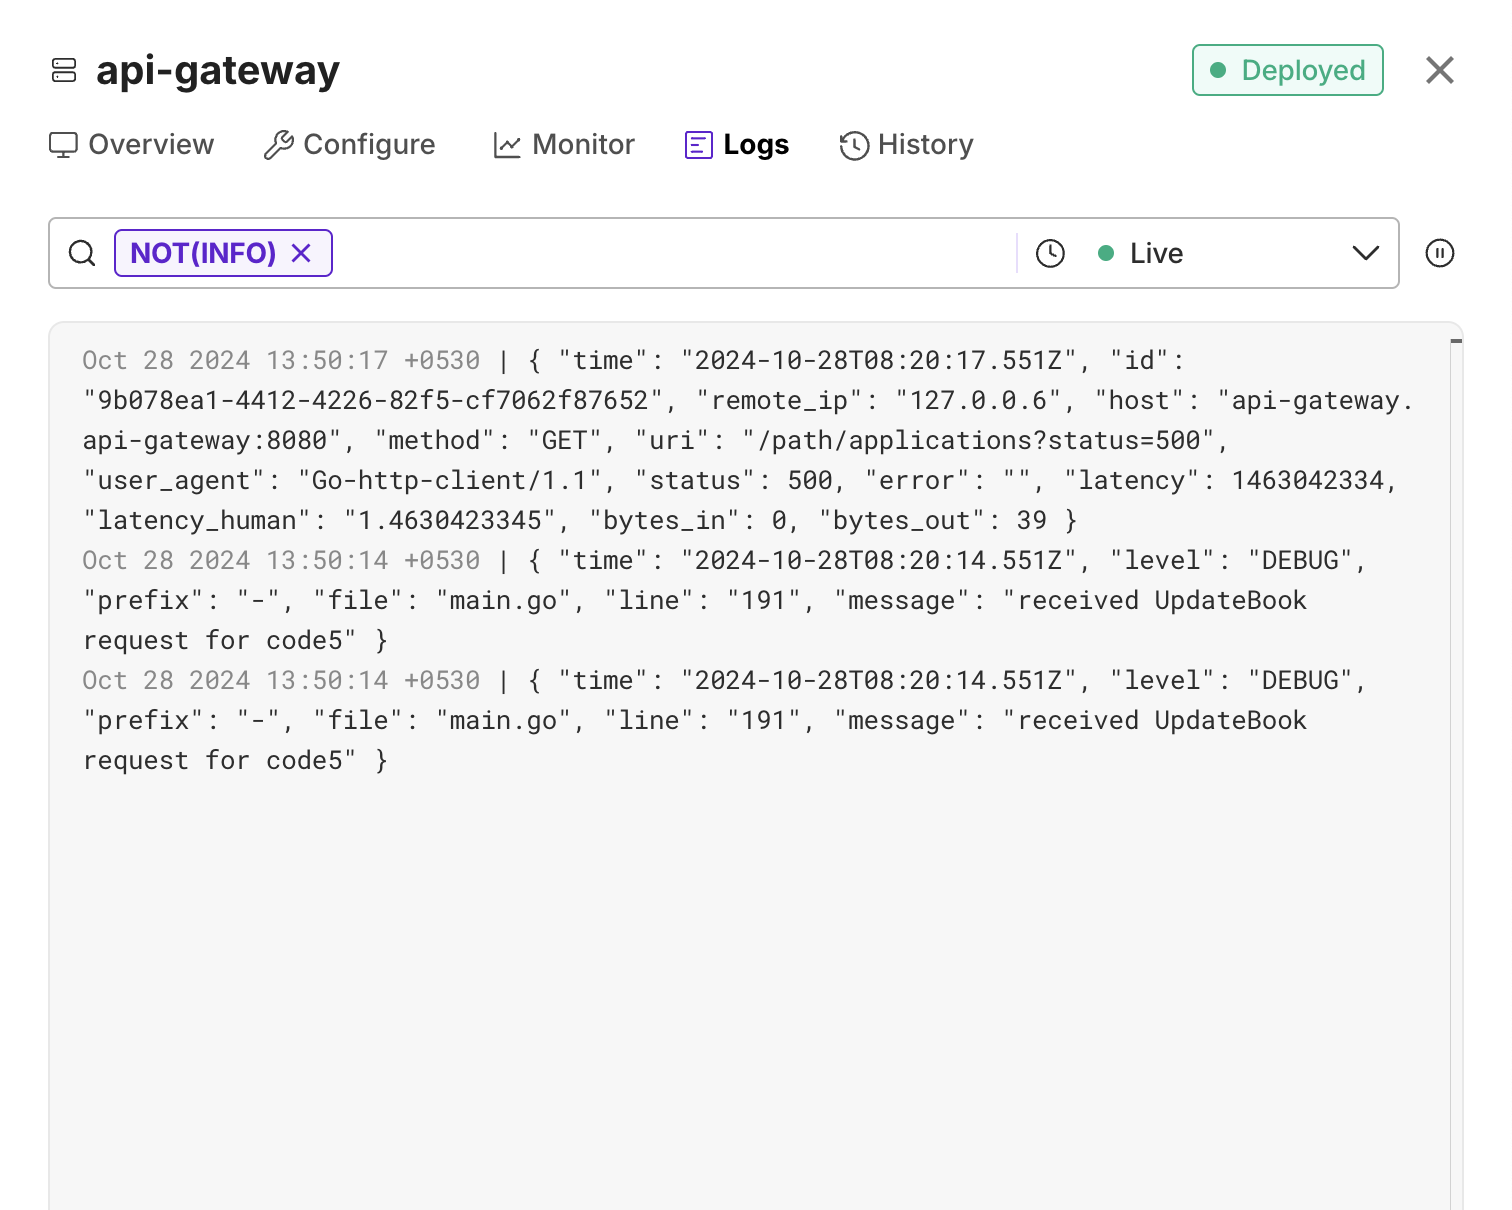
You can also choose to skip logs which contain certain keywords. Wrap the keywords with NOT() to skip the logs. Example: To remove logs which have "INFO" in them, add NOT(INFO) as the keyword.

Pod filter
If your service has multiple pods running, you can add the POD filter from the dropdown to look for logs in a specific pod.
After selecting a pod, page will show the logs from the selected pod with the latest logs starting from the top.
If you don't specify a pod, you'll see logs from the first pod by default.

Container filter
If your service is running multiple containers, you can add the CONTAINER filter from the dropdown to look for logs generated by a specific container.
After selecting the CONTAINER filter, you'll see a list of running containers for your service.
If your service is running multiple containers, you'll find a filter for the first container applied by default.

Pause/Play real-time logs
If you need to focus on certain set of logs, you can click "pause" button on right side of search-bar. This will pause real time logs and current logs will stay on page. When you want to go back to latest logs, click on "play" button.
Scrolling down to the set of logs that you need to focus on will again pause real time logs and current logs will stay on page. If you want to go back to the latest logs, just click on the "play" button and it would automatically scroll to the latest logs.
Limits
- It shows real time logs from only one pod & one container at a time.
- It shows maximum 1000 log lines.
- It can show logs from currently running pod and containers only. For viewing logs from currently terminated pods & containers, use Search Logs

