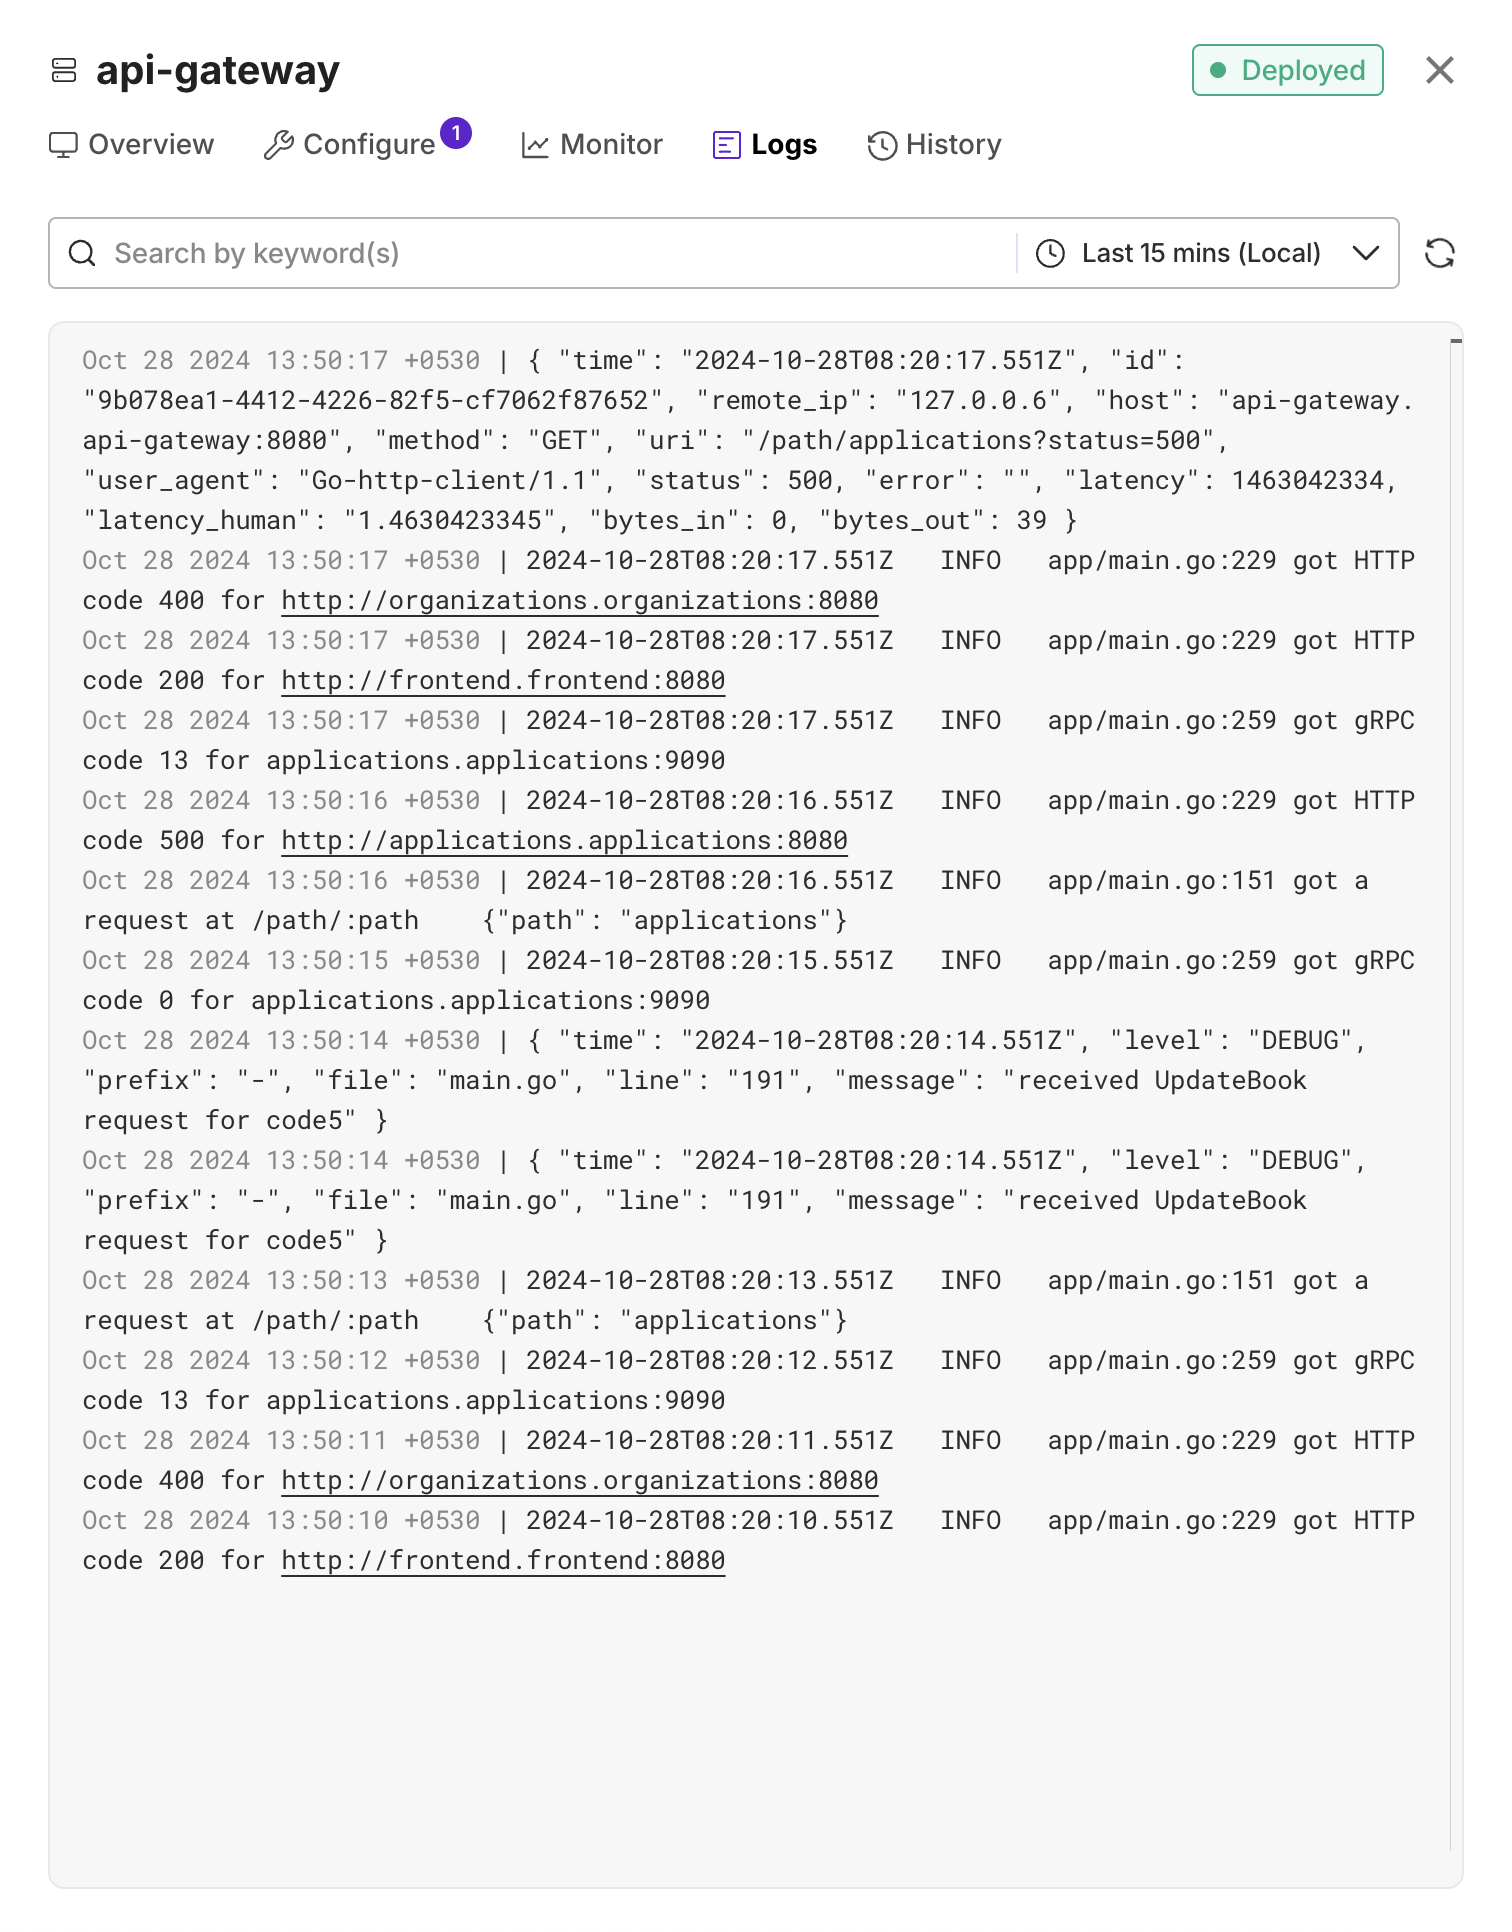
Search Logs
"Search Logs" feature allows you to efficiently search for specific information within log files. This functionality is crucial for pinpointing events, errors, or patterns within logs, aiding in troubleshooting and analysis.

Kapstan provides two flavors of "Search Logs" feature
- Search logs for specific service
- Search logs for all services
- Access this page by going to Services page.
- Click on "Logs" tab in the top navigation.
Navigating Logs
Initially, only the latest 1000 logs within the selected time-range would be displayed. Additional logs will load automatically as you scroll to the bottom. There are some controls at the top section to help you narrow down the scope of logs search or to switch view to help you with your debugging.

Search box
To search for a specific keyword, type the keyword in the "Search" box and press enter. The page would show only those logs that have the specified keyword present in them. The searched keywords would also be highlighted separately.
If multiple keywords are specified, then only those logs would be displayed that have all specified keywords present in them.
You can also choose to skip logs which contain certain keywords. Wrap the keywords with NOT() to skip the logs. Example: To remove logs which have "warn" in them, add "NOT(warn)" as the keyword.
Timezone control
You can use these controls to switch between the timezones. At present, you can choose between two options:
- Local: Shows the logs as per your browser's timezone.
- UTC: Displays logs in Coordinated Universal Time (UTC).
Your selected timezone preference would be persisted across sessions.
Time Range selector
You can use "Time Range" selector to
- either select one of predefined quick ranges
- or, specify custom range
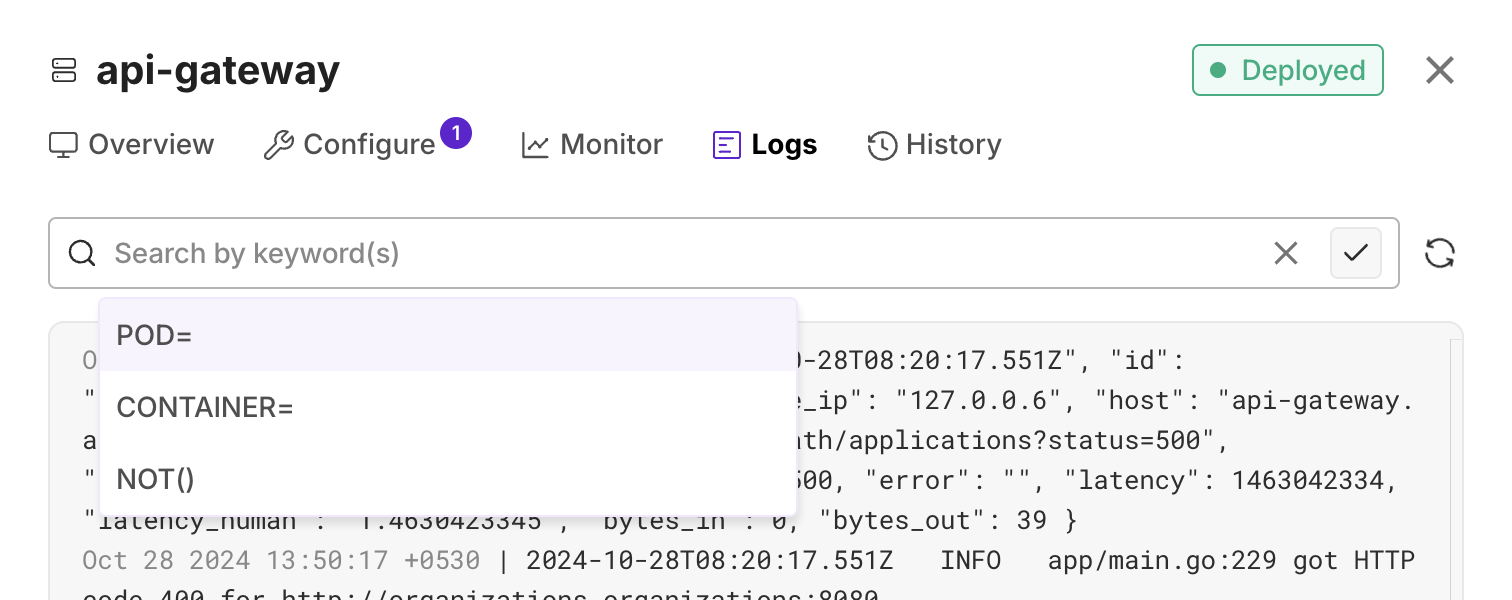
Pod filter
This option is only available when searching logs for specific service.
If your service has multiple pods running, you can add the POD filter from the dropdown to look for logs in a specific pod. If you don't add a filter for pods, by default you'll see logs across all pods running the service including terminated pods that are no longer active.
Container filter
This option is only available when searching logs for specific service.
If your service is running multiple containers, you can add the CONTAINER filter from the dropdown to look for logs generated by a specific container. After selecting the CONTAINER filter, you'll see a list of running containers for your service. If no filter is applied, you'll see logs generated by all containers of your service.
Refresh button
You can use the refresh button to get fresh logs for the selected time-range.
Services dropdown
This dropdown is only available when searching logs for all services.
 You can use the "Services" dropdown to search logs for one specific service or multiple services at once.
By default, all services are selected. Choosing services from the dropdown will only include logs of the selected services within the selected time-range.
Surrounding logs of a specific log
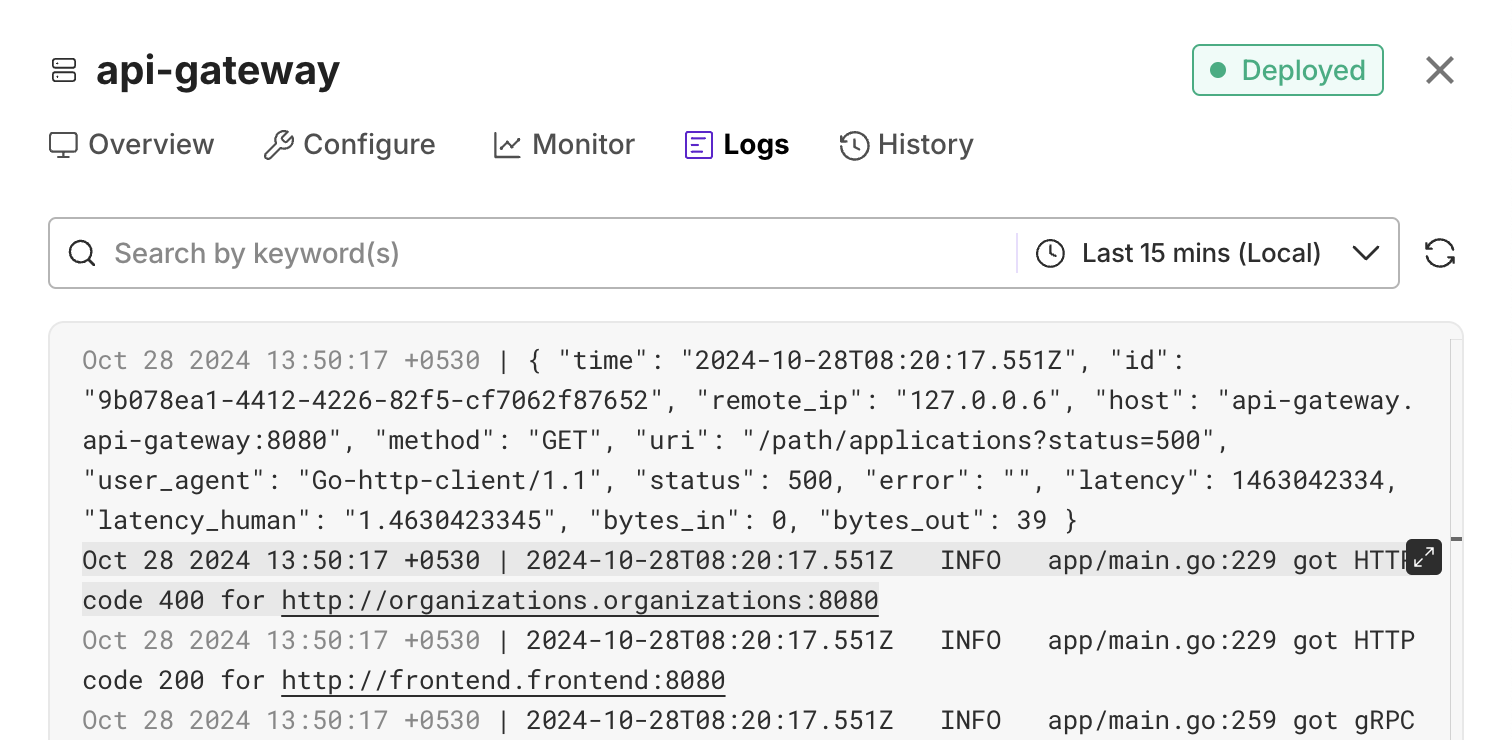
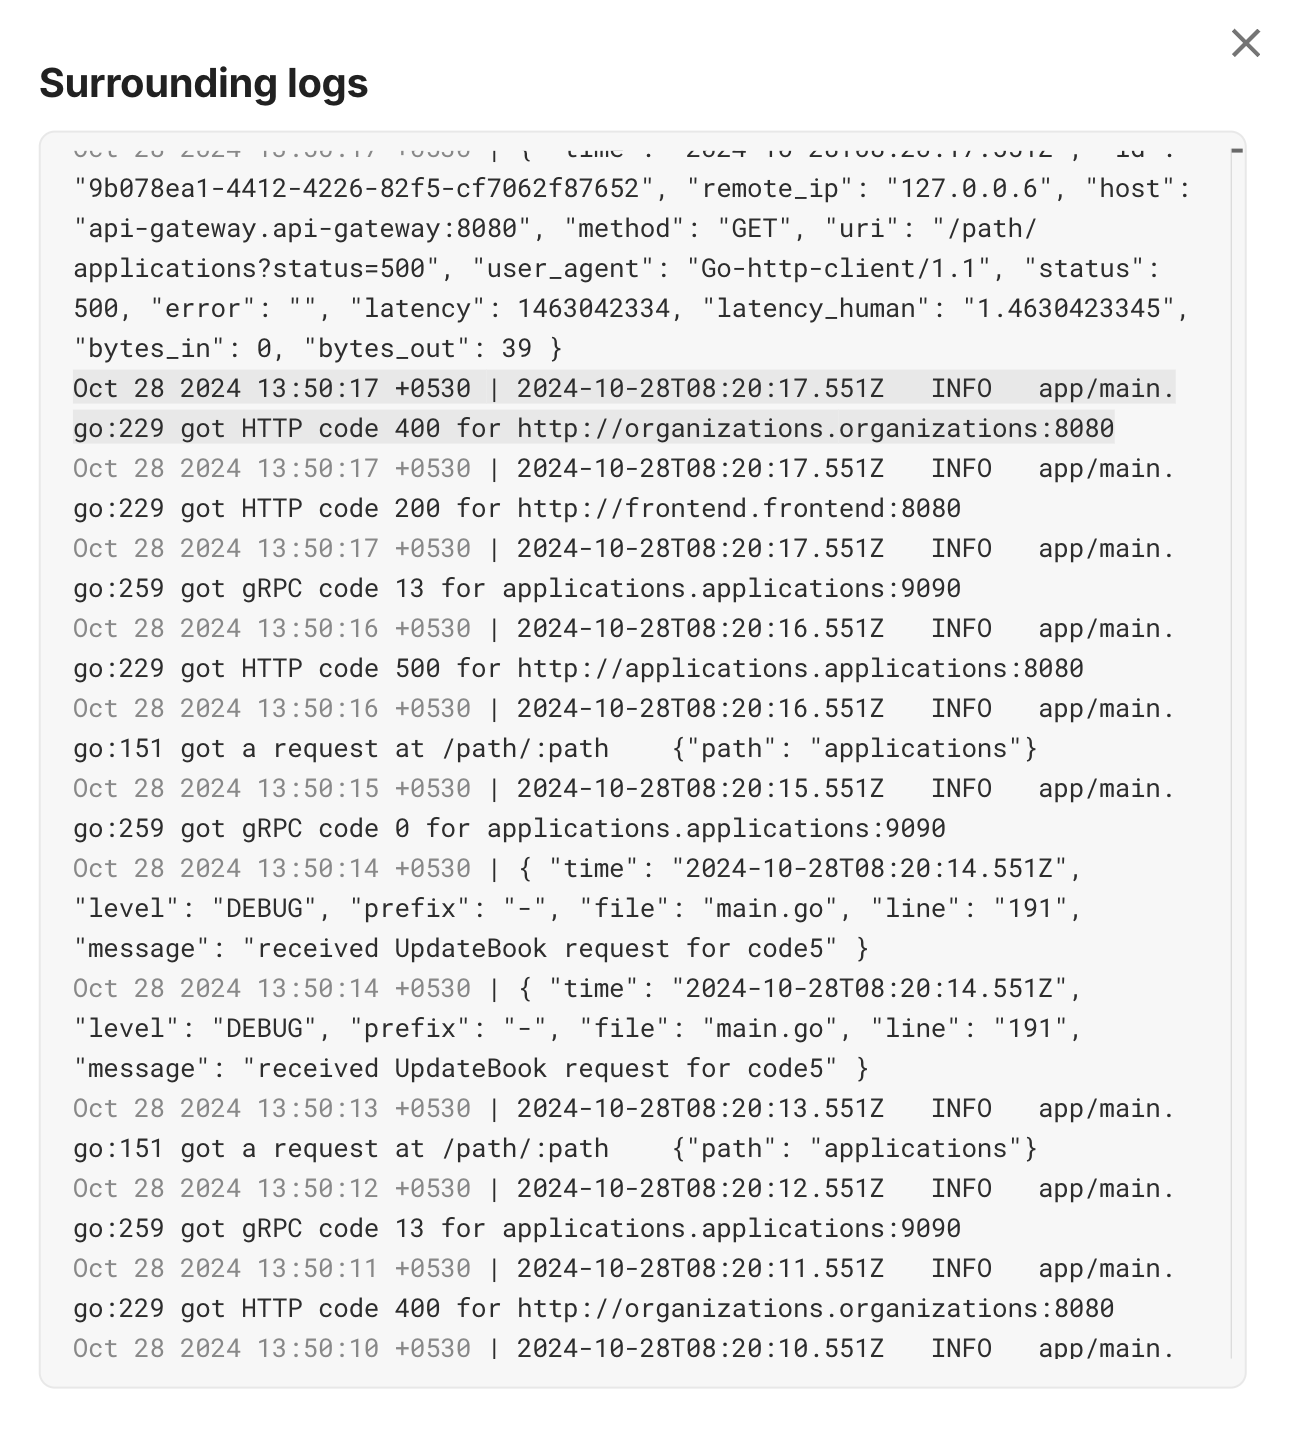
If you want to debug around a specific log to determine what caused it, you can do so by checking the surrounding logs.
Hovering over any log would show a button at the end of the log. Click on it to access the surrounding logs for that log.

The selected log would be highlighted separately and the keywords used in search logs would also be highlighted. The selected log's previous 500 logs and it's next 500 logs would be shown.

Limits
- Only the last 7 days logs are available for search.
- At most 1000 surrounding logs of a log would be shown.

